
Blocmount's Data Analytics Pipeline (DAP)
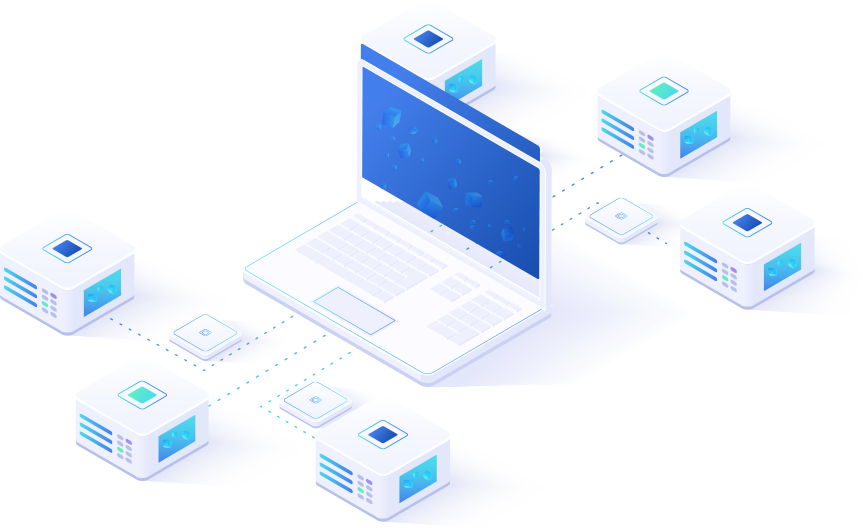
Collect
- Data is collected from your various devices and fed into our pipeline
Analyze
- Contextual AI-powered analysis provides actionable items and raises alerts
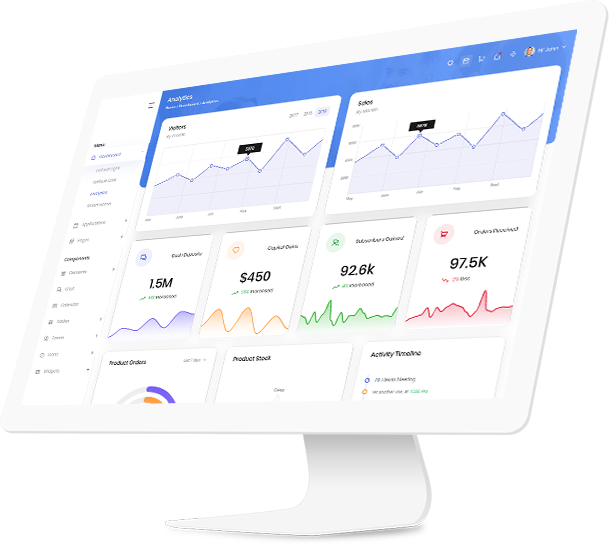
Visualize
- Interactive real-time dashboards give a live view of operations
Blocmount's Unified Dimension (UniDim)
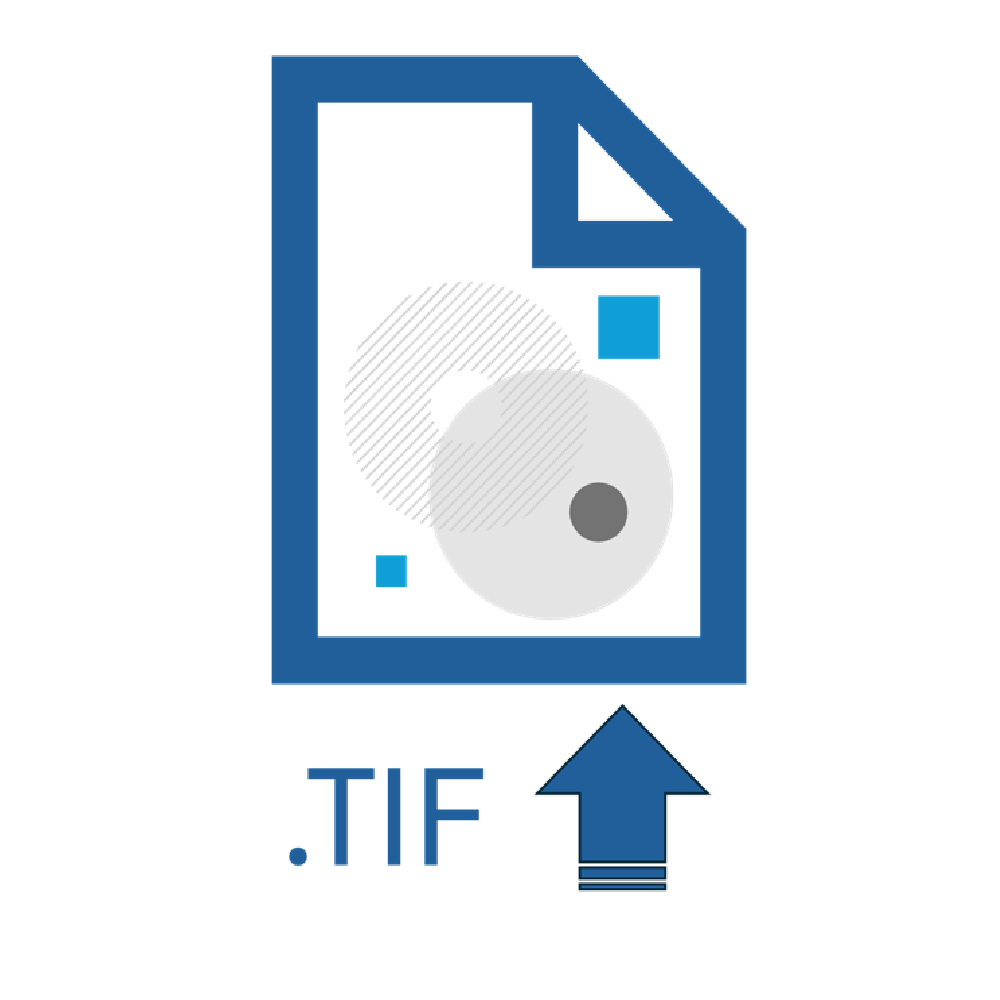
Upload
- Upload an drawing file (e.g., tif) to be scanned for dimensions to be detected.
- Decide the scope of work (e.g., conversion, plating).

Confirm/Override/Redacte
- AI-powered analytics detect and suggest replacements for every dimension based on the scope of work.
- Confirm and/or override any dimension.
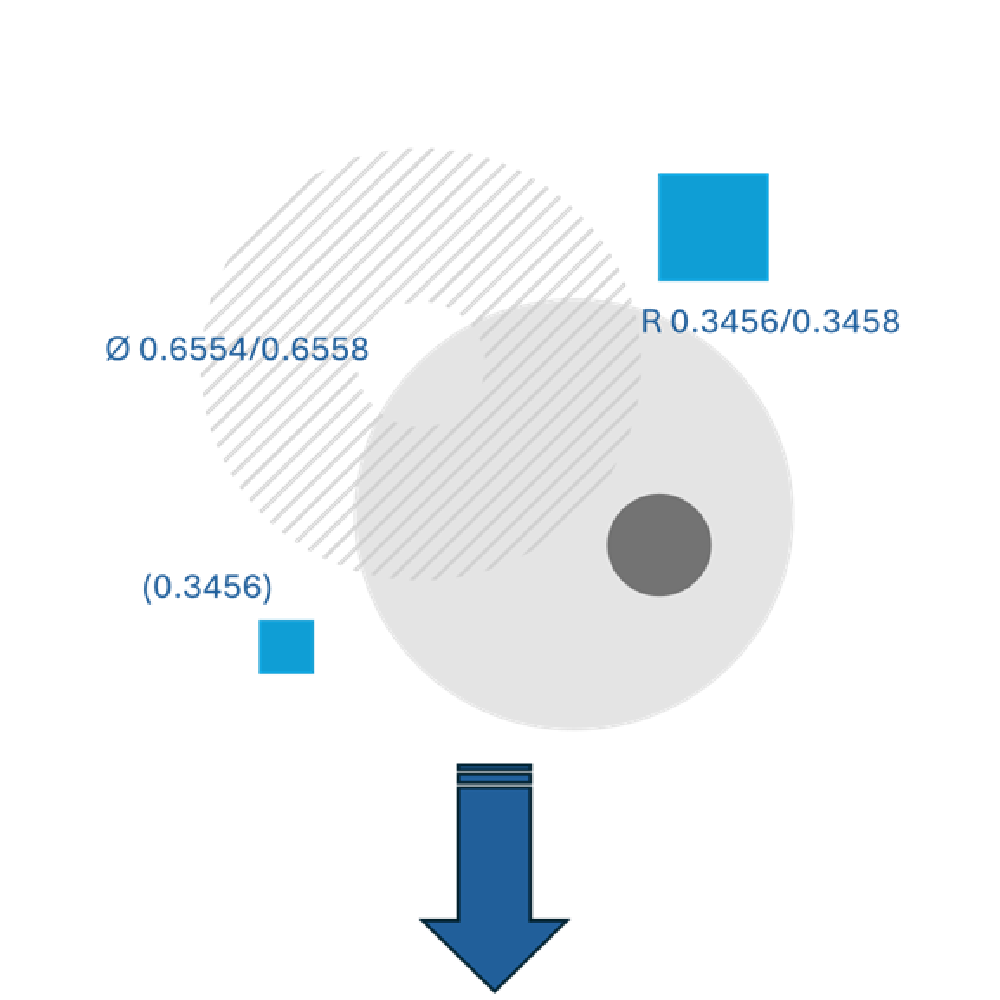
Download
- Download an updated drawing that can be safely shared on the floor for operators to use.
Sample Solutions
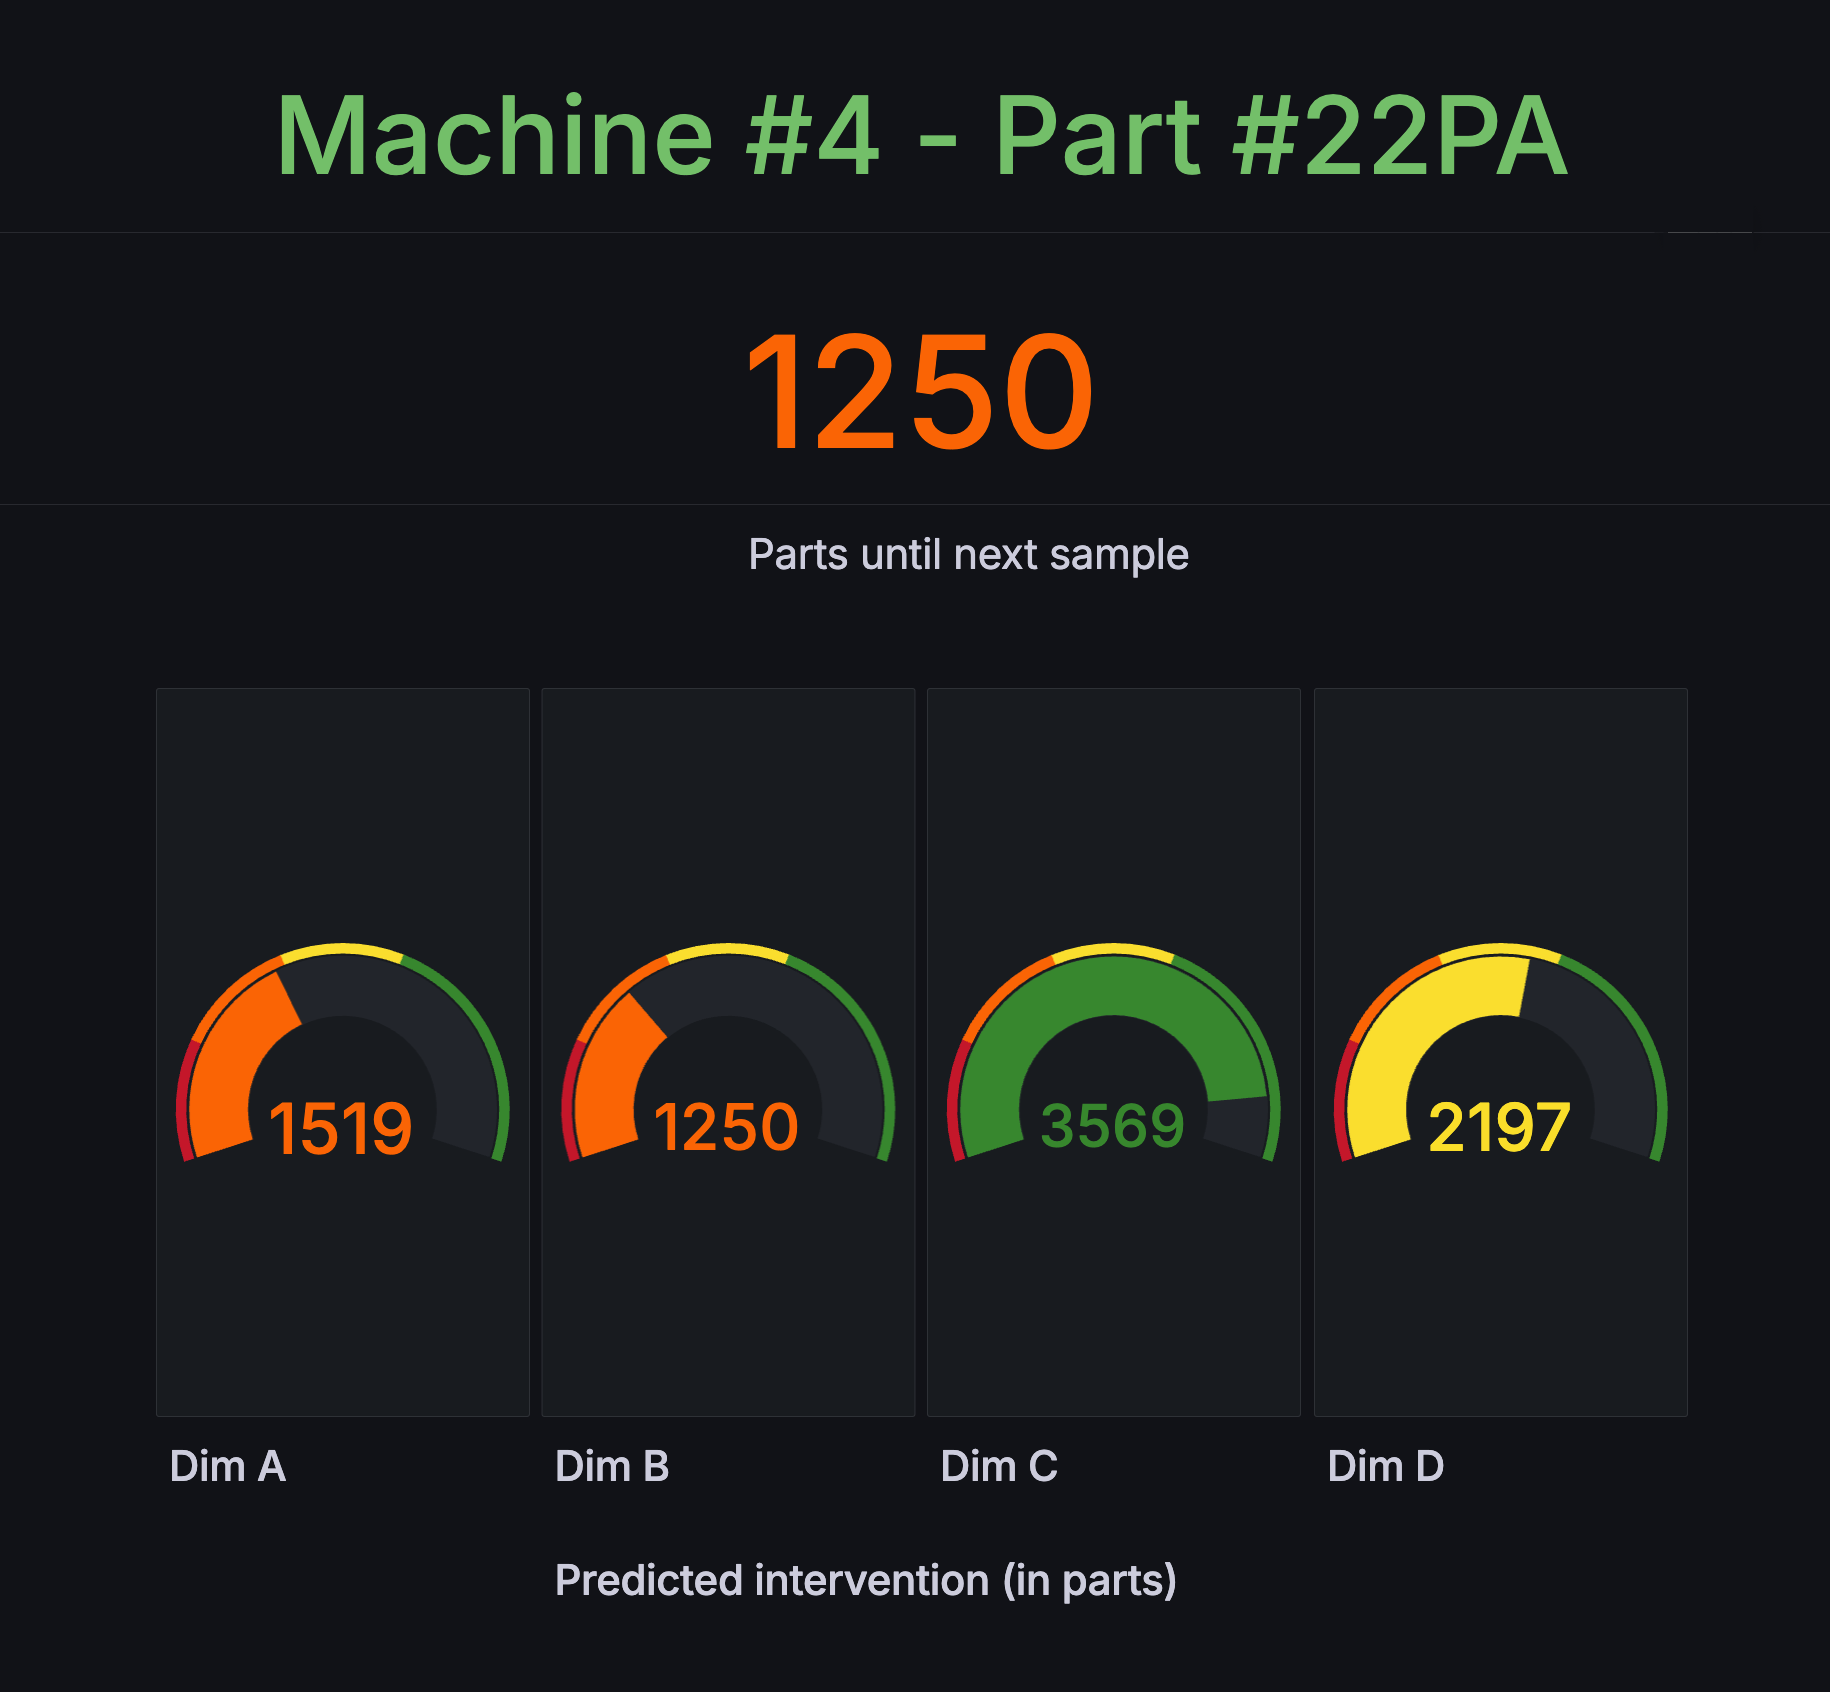
Our analysis led to 56% increase in the inter-sample time, which significantly reduces the workload on operators.

We developed an application that utilizes Fanuc Focas to acquire live machine data and alert operators.